## [# 10 Most Popular Bond ETFs of 2025 ](/sections/features/10-most-popular-bond-etfs-2025)
# 10 Most Popular Bond ETFs of 2025
Investors have poured $235 billion into fixed income ETFs this year. These 10 are leading the way.
[](/authors/sumit-roy)
[By Sumit Roy ](/authors/sumit-roy)
Aug 21, 2025
Edited by: ETF.com Staff
[ + Follow ](/etf/login)
Share Email LinkedIn Facebook X (Twitter)
googletag.cmd.push(function() {
googletag.display('js-dfp-tag-article_page_302x26');
});
Loading
It’s been about three years since interest rates surged in 2022, when the Federal Reserve hiked aggressively to combat the worst inflation in decades. Since then, rates have stayed elevated, but the path forward has never felt settled.
After a brief rate-cutting stint in 2024, the Fed went on pause. In 2025 the U.S. central bank has so far held rates unchanged, but there’s been constant debate about when another easing cycle might begin.
A cooler labor market argues for cuts, while persistent inflation pressures argue against them. Political pressure on the Fed from President Trump, along with renewed trade frictions that have pushed some foreign buyers away from Treasuries, has added to the uncertainty.
With forces pulling in multiple directions, bonds have largely stayed range bound this year. Yet despite that stability, unease remains high, and that trepidation is showing up in ETF flows. The ten most popular bond ETFs this year have pulled in $85 billion.
Most of that money has rushed into the safest corners of the market or into broad, low-cost core bond funds. Far less has gone into higher-risk plays.
## Ultra-Short-Term Bonds
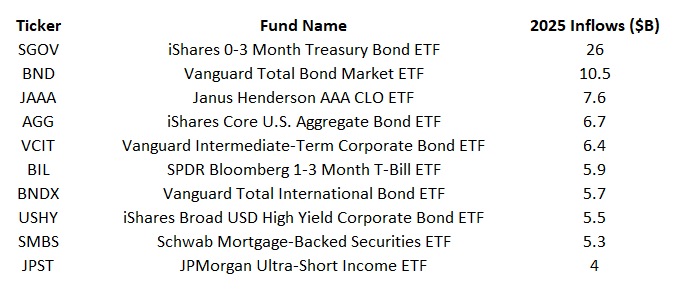
At the top of the list sits the [**iShares 0-3 Month Treasury Bond ETF (SGOV)**](/sgov), which has absorbed $26 billion and now stands at $56 billion in assets. The [**SPDR Bloomberg 1-3 Month T-Bill ETF (BIL)**](/bil) is also among the top 10, with $5.9 billion of inflows and $42 billion in assets
Two forces explain the heavy demand for these ultra-short-term bond ETFs. The first is safe-haven positioning. With the Fed’s path uncertain and the outlook for the economy murky, many investors are sticking with T-bills and avoiding duration risk.
The second is structure. ETFs like SGOV and BIL are increasingly being used as money market mutual fund alternatives, giving investors cash-like safety with the added benefit of intraday liquidity. With $7.2 trillion already in money markets, even a modest reallocation into ETFs can create massive flows.
Another ultra-short fund, the [**JPMorgan Ultra-Short Income ETF (JPST)**](/jpst), has also climbed into the top 10 with $4 billion of inflows. The fund takes on modest credit exposure to push yields slightly higher while maintaining almost no interest rate risk.
googletag.cmd.push(function() {
googletag.display('js-dfp-tag-in_article_unit');
});
## CLOs
One fund that sits adjacent to the ultra-short-term bond space is the [**Janus Henderson AAA CLO ETF (JAAA)**](/jaaa), which has attracted $7.6 billion this year, lifting assets to $24 billion. While it is not risk-free like T-bill ETFs such as SGOV and BIL, JAAA invests in the safest tranches of collateralized loan obligations.
CLOs bundle together pools of corporate loans, carve them into slices, and pass the cash flows to investors. The AAA-rated pieces JAAA holds have historically experienced very low default rates.
Because CLOs pay floating rates, they carry little interest rate risk. That mix of low credit risk and minimal duration exposure has made JAAA a magnet for inflows. As of today, investors pick up a yield premium of about 100 basis points compared with T-bill ETFs.
## Core Bond Funds
Low-duration ETFs have dominated flows, but investors have not avoided interest rate risk altogether. Broad bond market funds, which serve as the core building blocks of diversified portfolios, have also seen steady demand.
The [**Vanguard Total Bond Market ETF (BND)**](/bnd) has attracted $10.5 billion, while the [**iShares Core U.S. Aggregate Bond ETF (AGG)**](/agg) has added $6.7 billion. With $135 billion and $129 billion in assets, they remain the largest bond ETFs and the backbone of many stock-and-bond portfolios.
After years of paltry yields and then a sharp plunge in 2022, these funds have started to deliver solid gains. Both are up 4.4% year-to-date through August 21.
That demand for core exposure extends overseas as well. The [**Vanguard Total International Bond ETF (BNDX)**](/bndx) has pulled in $5.7 billion this year. It offers hedged exposure to global debt and has returned 1.8% in 2025.
## Corporate Bonds and Mortgages
Some investors have supplemented their core holdings with corporate bond exposure to pick up extra yield. The [**Vanguard Intermediate-Term Corporate Bond ETF (VCIT)**](/vcit) has gathered $6.4 billion and gained 6.1% this year. It holds investment-grade corporates with maturities of five to ten years, offering higher yields than Treasuries while taking on moderate credit risk.
For those willing to stretch further, the [**iShares Broad USD High Yield Corporate Bond ETF (USHY)**](/ushy) has pulled in $5.5 billion. With nearly 2,000 holdings, it is one of the most diversified junk bond ETFs available.
Its SEC yield is close to 7%, and it has returned 5.6% so far this year. High yield bonds have benefited from a stable credit backdrop, though they would be the first to suffer if the economy weakens.
Junk bonds also tend to carry shorter maturities and higher coupons than investment-grade corporates. That gives USHY a duration of about three years compared with roughly eight years for the [**iShares iBoxx $ Investment Grade Corporate Bond ETF (LQD)**](/lqd) and six years for the aforementioned VCIT.
In other words, investors in USHY take on more credit risk but less interest rate risk.
The [**Schwab Mortgage-Backed Securities ETF (SMBS)**](/smbs) rounds out the top 10 with $5.3 billion of inflows. SMBS holds mortgage-backed securities, which technically carry credit risk but are effectively government guaranteed.
They come with quirks that set them apart from Treasuries. Because mortgages can be prepaid when rates fall and extended when rates rise, these bonds are less predictable than Treasuries. As a result, investors usually demand extra yield to hold them.
## What the Flows Show
The top 10 bond ETF inflows this year highlight investors’ preference for safety. The bulk of money has moved into funds with little to no interest rate risk and into core broad market funds. A smaller slice has gone into credit for extra yield, while appetite for long duration remains limited.
In fact, two of the three bond ETFs with the biggest outflows this year are long duration funds. The [**Vanguard Long-Term Corporate Bond ETF (VCLT)**](/vclt) has lost $6.7 billion, and the [**iShares 20+ Year Treasury Bond ETF (TLT)**](/tlt) has shed $2.4 billion.
Investors want yield, but they are not willing to take on much interest rate risk to get it.
[ + Follow ](/etf/login)
[ Sumit Roy Senior ETF Analyst ](/authors/sumit-roy)
Sumit Roy is the senior ETF analyst for etf.com and author of (Don't) Invest Like a Pro. He creates a variety of content for the platform, including… [View Bio](/authors/sumit-roy)
Related Topics [Bond](http://www.etf.com/topics/bond)
[Fixed Income](http://www.etf.com/topics/fixed-income)