## [# US Stock ETFs Brush Off Head Winds](/sections/news/us-stock-etfs-brush-head-winds)
# US Stock ETFs Brush Off Head Winds
Despite a multitude of head winds, U.S. stocks are within 1% of their all-time highs.
[](/authors/sumit-roy)
[By Sumit Roy ](/authors/sumit-roy)
Sep 17, 2019
Edited by: Sumit Roy
[ + Follow ](/etf/login)
Share Email LinkedIn Facebook X (Twitter)
googletag.cmd.push(function() {
googletag.display('js-dfp-tag-article_page_302x26');
});
Loading
For all the incessant talk over the past month about trade wars, inverted yield curves and recessions, you might have thought the stock market would be much lower than it is. Instead, the S&P 500 has quietly crept up to 3,000, less than a percentage point below its all-time high set in July.
Including dividends, the [**SPDR S&P 500 ETF Trust (SPY)**](https://www.etf.com/SPY) is now up 21.2% year to date, which, if the year ended here, would be good enough for the best annual return since 2013. Talk about climbing a wall of worry.
The market reflects the fact that, despite facing many head winds, the U.S. economy continues to grow steadily. Gross domestic product expanded by more than 2.5% in the first half of the year, and is anticipated to continue growing at a 2%-plus rate in the second half. At the same time, the jobless rate is holding steady at a 50-year low.
The tit-for-tat trade war between the U.S. and China has certainly been a drag, but not enough to dent consumer confidence and spending. Likewise, the slowdown in Europe hasn’t spread to the U.S., and there’s hope that Federal Reserve rate cuts can buttress the domestic economy from any overseas weakness.
**Stocks Following Earnings**
To be sure, what happens overseas does matter for U.S. stocks, especially those in the S&P 500, which often have international operations. About 43% of sales for S&P 500 companies come from overseas, according to Standard & Poor’s.
It’s a key reason corporate earnings this year have stalled. Figures from FactSet show that analysts expect earnings for S&P 500 companies to only climb by 1.4% in 2019, the weakest growth since the 2014–2016 period, when earnings last flattened out.
Tepid earnings growth is likely the reason the S&P 500 hasn’t risen much in the past year and a half. Sure, it’s up more than 21% this year, but that’s from the rock-bottom levels of last year, following a 20% peak-to-trough decline.
In fact, the S&P 500 traded as high as 2,873 in January 2018. From there, it’s only risen about 4.4%. That’s not to discount the resiliency of the market—it’s held up extraordinarily well in the face of a lot of negative headlines—but it indicates stocks have largely been moving in line with earnings. Profits have been only inching higher over the past 1 1/2 years, and so has the market.
**S&P 500**

**Measuring Factor Returns**
Of course, the S&P 500 isn’t everything. It’s a good barometer of U.S. large cap stocks, but it doesn’t say much about what’s going on with smaller stocks, individual sectors or international stocks.
Markets this year have been far from homogeneous. Those various segments have seen a much different ride than the S&P 500.
U.S. small caps, for example, as measured by the [**iShares Russell 2000 ETF (IWM)**](https://www.etf.com/IWM), are up 18.7% this year, but still down 8.9% from their all-time highs. U.S. midcaps are up 19.5% on the year, but down 4.2% from their highs.
In terms of factor ETFs, the [**Vanguard Value ETF (VTV)**](https://www.etf.com/vtv) is up 16.7% year to date, but it’s still being outperformed by the equivalent growth ETF, despite the recent rotation from growth to value. The [**Vanguard Growth ETF (VUG)**](https://www.etf.com/vug) returned 25.9% so far this year.
Momentum, low volatility and quality strategies are also outperforming value. The [**iShares Edge MSCI U.S.A. Momentum Factor ETF (MTUM)**](https://www.etf.com/mtum) jumped 22.7%; the [**iShares Edge MSCI Min Vol U.S.A ETF (USMV)**](https://www.etf.com/usmv) rallied 22.7% on the year; and the [**iShares Edge MSCI U.S.A Quality Factor ETF (QUAL)**](https://www.etf.com/qual) added 22.2%.
The [**Vanguard High Dividend Yield ETF (VYM)**](https://www.etf.com/VYM) is a notable laggard among factor ETFs, returning only 16.2% on a total return basis.
**YTD Factor ETF Returns**

**Sectors Tilts**
The differing returns of the various factor ETFs can largely be explained by their tilts. As they stand now, most value ETFs are heavy in financials and health care; growth, momentum and quality ETFs are overweight technology and consumer cyclicals; low vol ETFs are dominated by financials and utilities; and high yield ETFs are spread fairly evenly among all the sectors.
Technology is still the best-performing sector of the year, so any ETFs overweight that group is doing well. The [**Technology Select Sector SPDR Fund (XLK)**](https://www.etf.com/xlk) has returned 31.5% so far in 2019, easily besting the 27.5% return for the [**Real Estate Select Sector SPDR Fund (XLRE)**](https://www.etf.com/XLRE), the No. 2 sector fund in the SPDR suite.
Consumer discretionary, communication services and industrials all follow suit, with returns in the 24% range, while health care and energy are the notable laggards, with gains of 6.4% and 11.9%, respectively.
**Sector ETF Returns**
TickerSectorYTD Return (%)**[XLK](https://www.etf.com/XLK)****Technology****31.5****[XLRE](https://www.etf.com/XLRE)****Real Estate****27.5****[XLC](https://www.etf.com/XLC)****Communication Services****24.3****[XLI](https://www.etf.com/XLI)****Industrials****24.3****[XLY](https://www.etf.com/xly)****Consumer Discretionary****23.9****[XLU](https://www.etf.com/XLU)****Utilities****20.9****[XLP](https://www.etf.com/XLP)****Consumer Staples****20.6****[XLF](https://www.etf.com/XLF)****Financials****20.4****[XLB](https://www.etf.com/XLB)****Materials****16.3****[XLE](https://www.etf.com/XLE)****Energy****11.9****[XLV](https://www.etf.com/XLV)****Health Care****6.4***Data measures total returns for the year-to-date period through Sept. 16*
**International Stocks Lagging**
Though not immune from the slowdown overseas, U.S. stocks have fared much better than their international counterparts. Returns for ETFs tied to other regions have sharply underperformed this year and longer term.
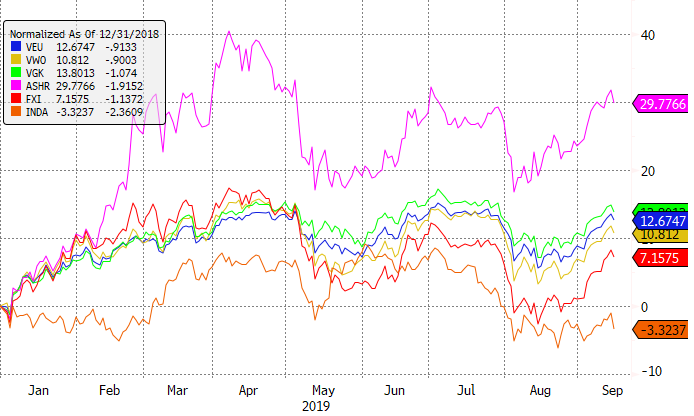
The [**Vanguard FTSE All-World ex-US ETF (VEU)**](https://www.etf.com/veu), for example, is only up 12.7% this year and is a long way from its recent high in January 2018, let alone its all-time high in 2007.
Emerging markets, in particular, have been lagging, with returns of only 10.8% for the [**Vanguard FTSE Emerging Markets ETF (VWO)**](https://www.etf.com/vwo).
Ironically, mainland Chinese stocks have done pretty well. The [**Xtrackers Harvest CSI 300 China A-Shares ETF (ASHR)**](https://www.etf.com/ashr) is up 29.8% year to date, but that’s coming off the depressed levels of last year. From a bigger picture perspective, ASHR hasn’t gone anywhere since its inception six years ago.
On the other hand, ETFs tied to Hong Kong, like the [**iShares China Large-Cap ETF (FXI)**](https://www.etf.com/fxi), have significantly lagged amid the political turmoil in that city. FXI is up a mere 7.2% this year.
The [**iShares MSCI India ETF (INDA)**](https://www.etf.com/inda) is another notable emerging market laggard, with a loss of 3.3% for the year so far.
**YTD Returns For Select Intl ETFs**
*Email Sumit Roy at* [*sroy@etf.com*](mailto:sroy@etf.com) *or follow him on Twitter* [*sumitroy2*](https://www.etf.com/sumitroy2)
[ + Follow ](/etf/login)
[ Sumit Roy Senior ETF Analyst ](/authors/sumit-roy)
Sumit Roy is the senior ETF analyst for etf.com and author of (Don't) Invest Like a Pro. He creates a variety of content for the platform, including… [View Bio](/authors/sumit-roy)
Related Topics [Equity](http://www.etf.com/topics/equity)
[U.S.](http://www.etf.com/topics/us)
[Large Cap](http://www.etf.com/topics/large-cap)
[Midcap](http://www.etf.com/topics/midcap)
[Small Cap](http://www.etf.com/topics/small-cap)