

The Merits of Rethinking Passive U.S. Equity Investing
For many investors, U.S. equity indices like the S&P 500 or the Russell 1000 are synonymous with owning the most significant and largest parts of the U.S. market. But while these benchmarks are constructed by using static constituent counts, the market is extremely dynamic – the number of companies and their concentrations fluctuate. As such, not owning the true totality of the U.S. market across cycles due to the fixed number index limitations can lead to missed opportunities. Furthermore, as concentration and the number of U.S. public companies fluctuate, fixed number methodologies may generate differentiated performance due to different risk allocation compared to U.S. equity indices that define market cap by percentiles – which present the market slices consistently through changing markets.
Owning the Large Caps
When the S&P 500 Index launched in 1957, it represented roughly 95% of the U.S. equity market, according to CRSP data. By the time the Russell 1000 Index arrived in 1984, it captured around 86% of the market’s capitalization. As the market evolved, the S&P 500’s share of the total equity universe dropped to about 74%, reflecting the growing number of publicly listed companies and shifts in market concentration.
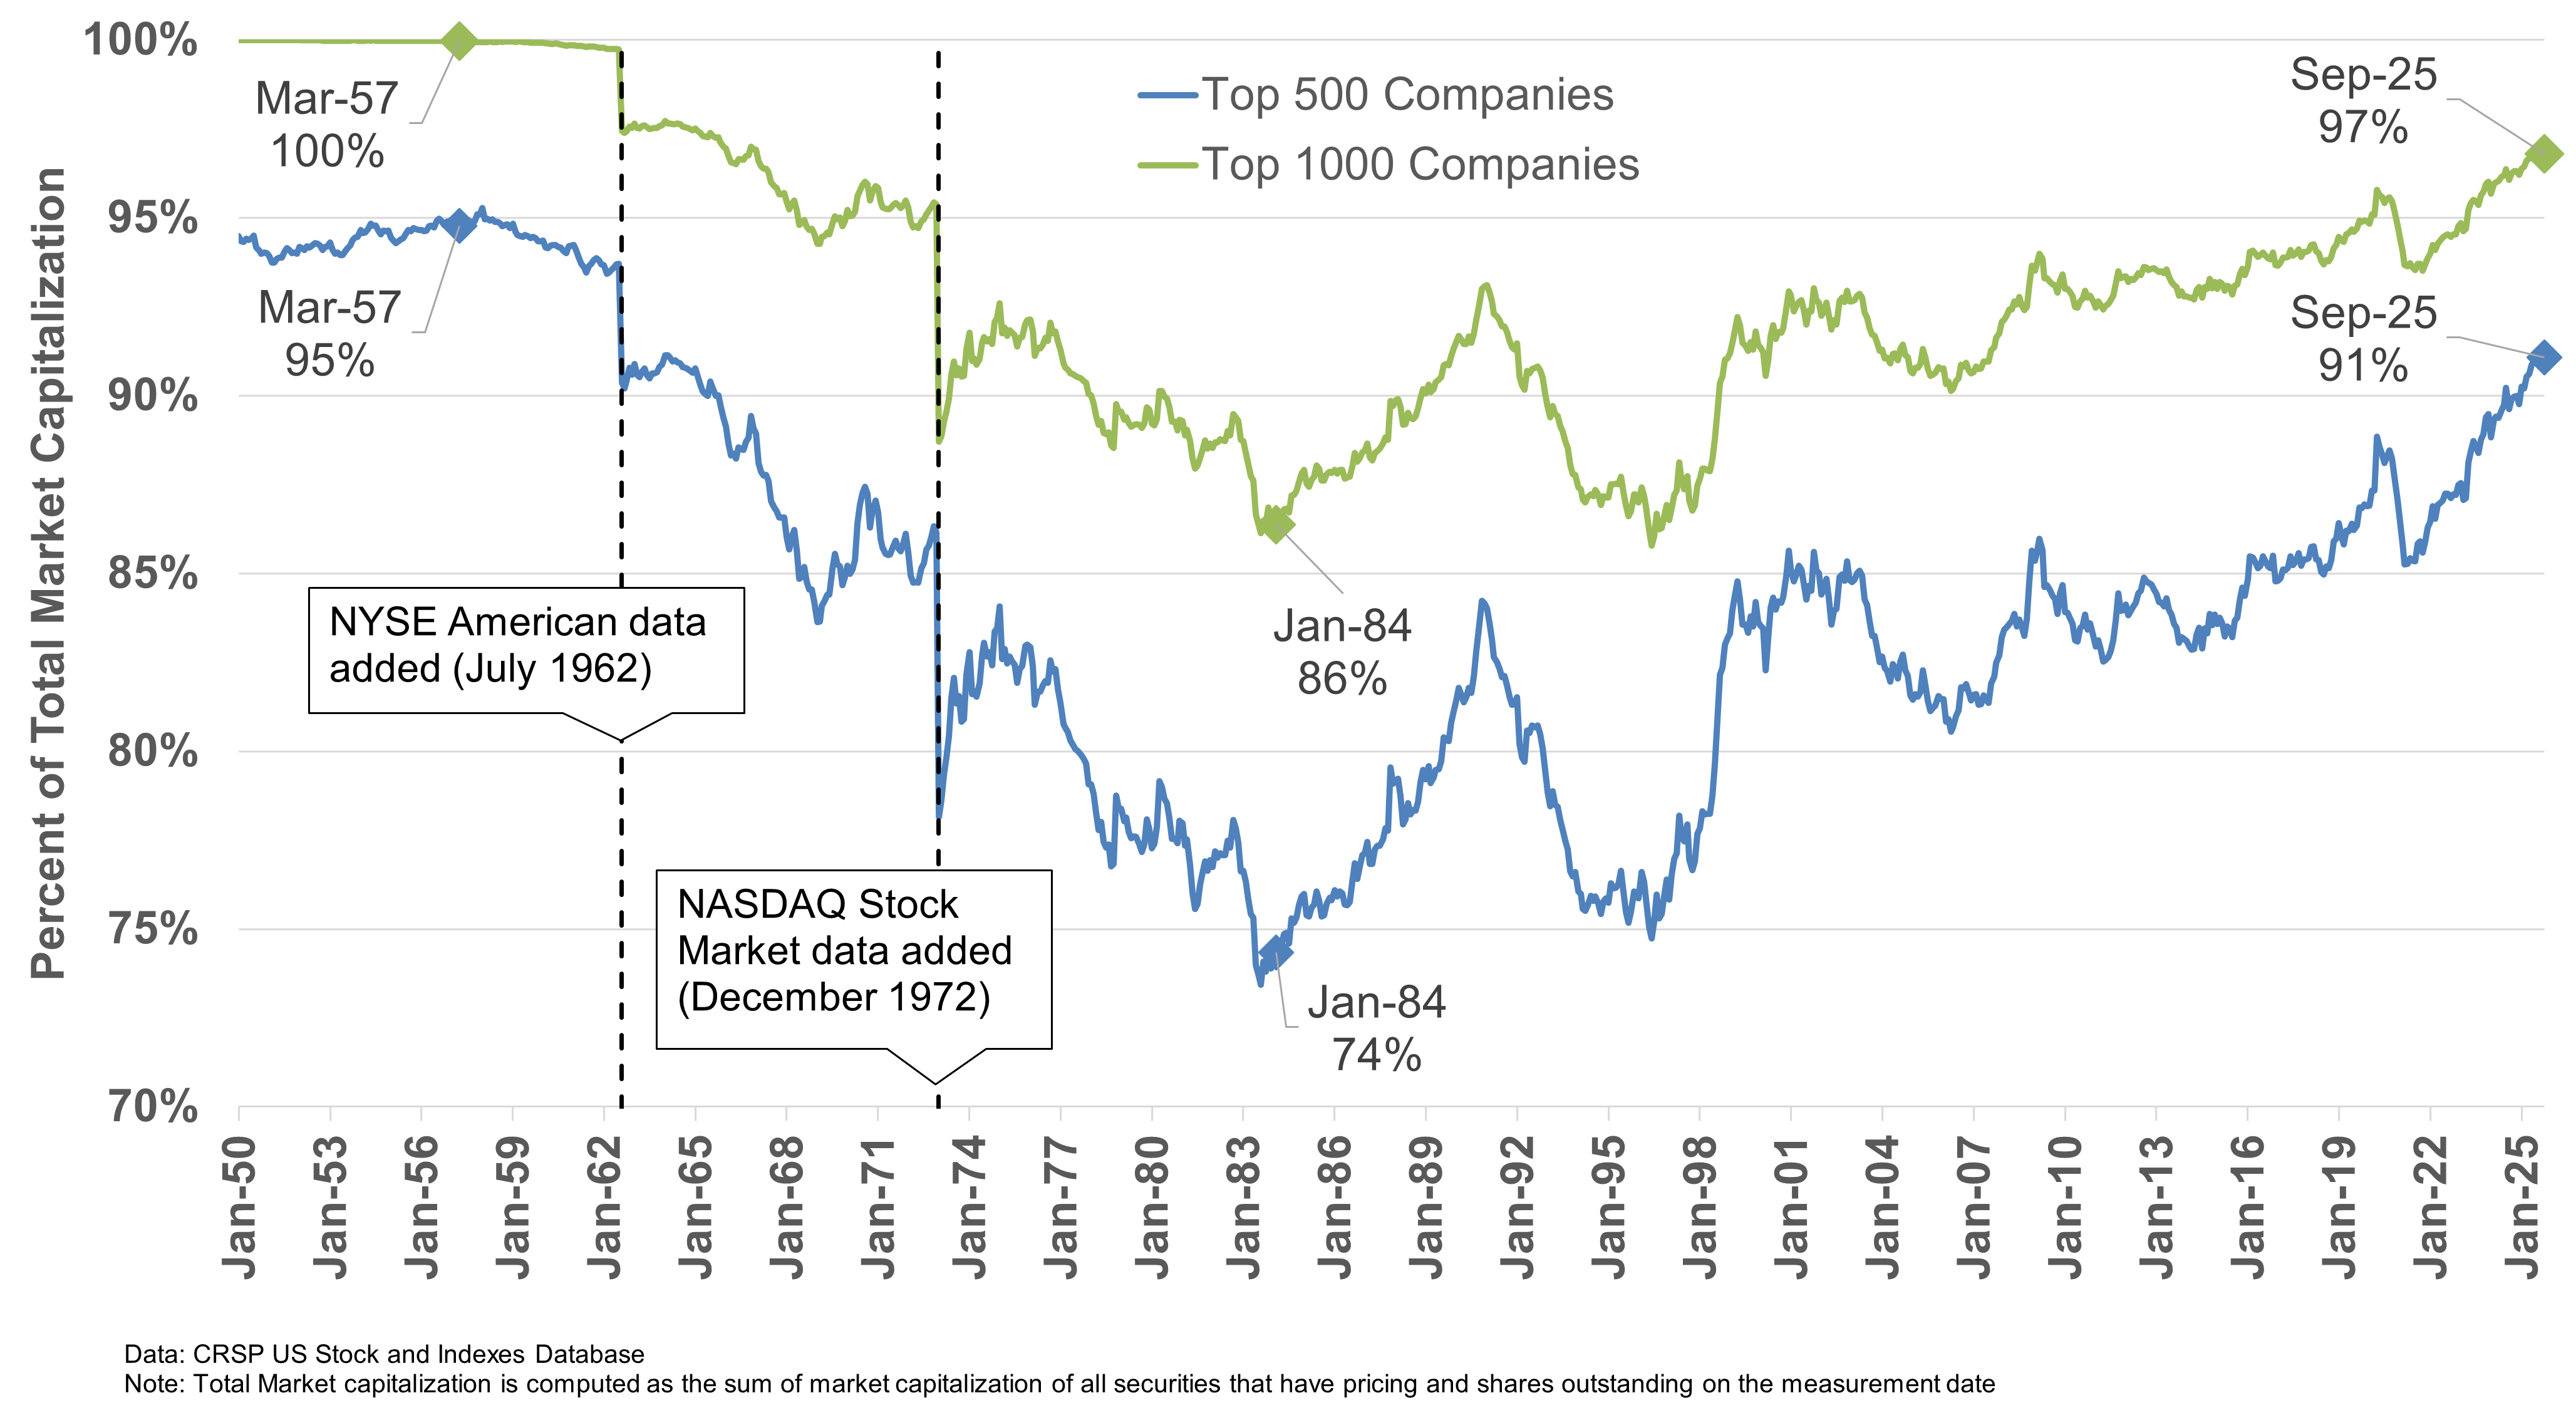
This highlights an important dynamic: benchmark indices tied to a fixed number of constituents can deliver highly variable market coverage over time. As the number of U.S. public companies fluctuates and concentration ebbs and flows, fixed-count indices capture different slices of the market in different eras — even when the methodology remains unchanged.
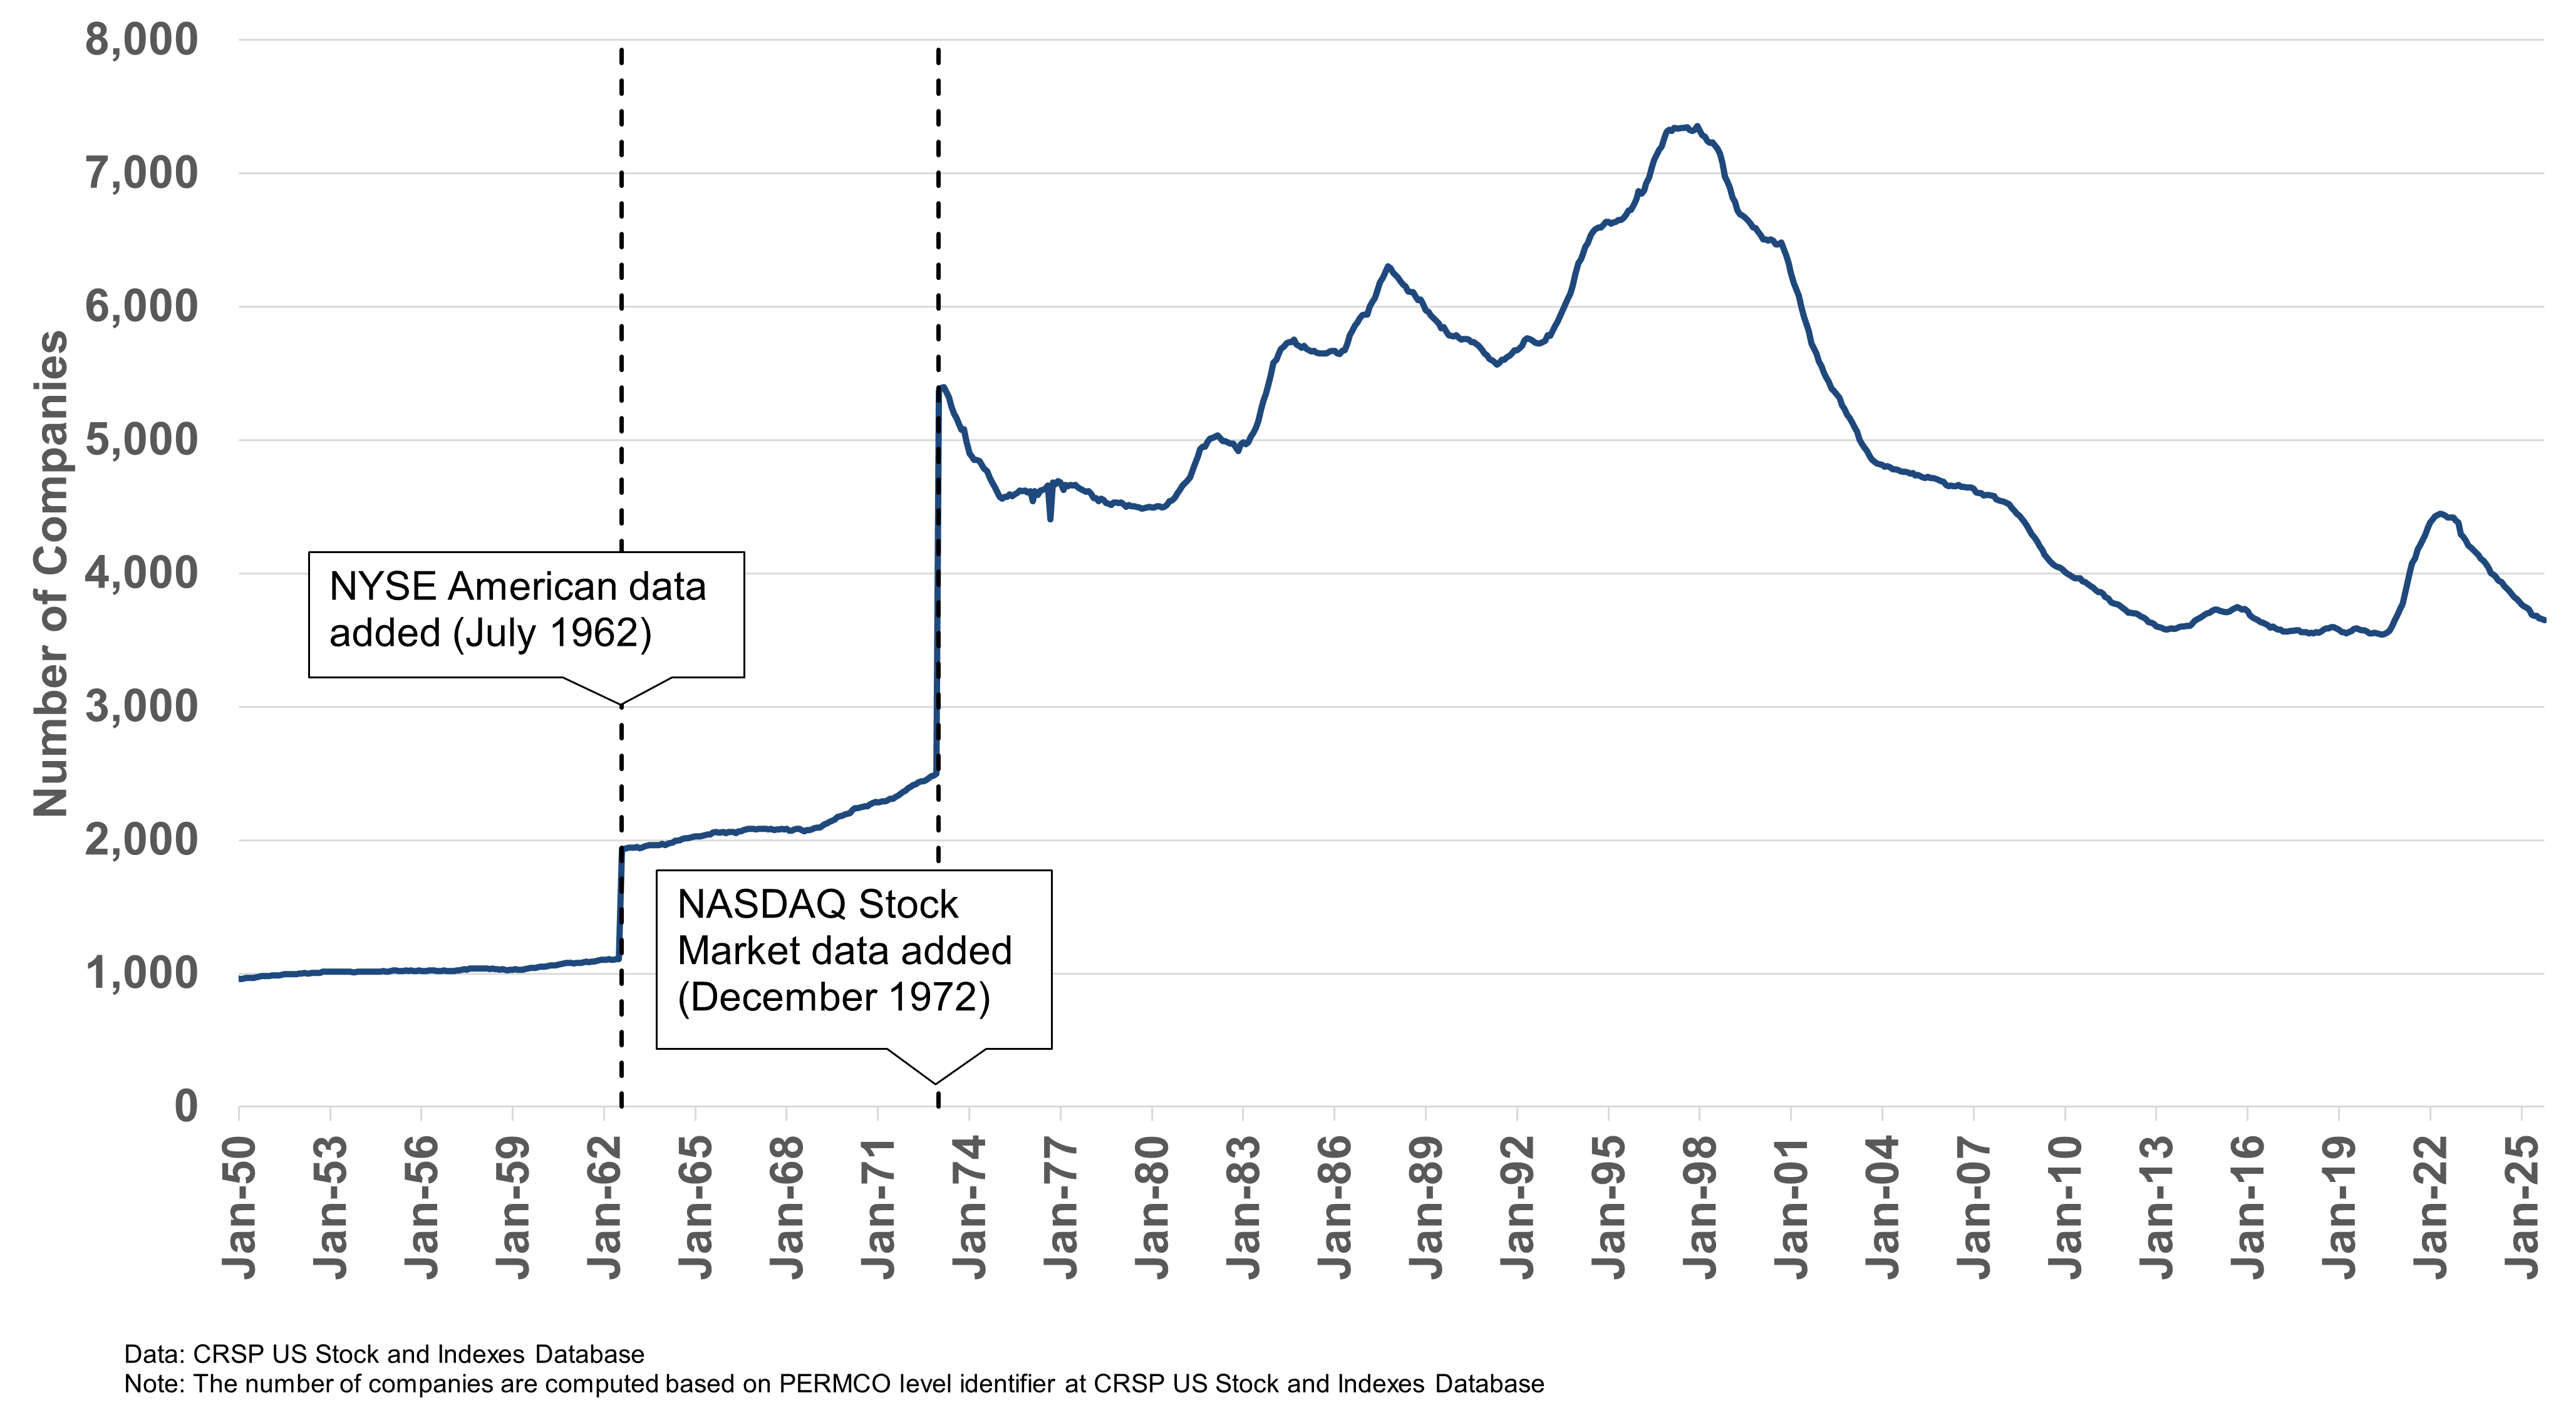
At the height of U.S. equity proliferation in 1997, more than 7,300 securities traded on U.S. exchanges, and the top 500 companies accounted for less than 80% of total market capitalization, per CRSP data. Today, only 461 companies make up roughly 85% of the U.S. equity market, and the number of listed companies has fallen to about 3,700 as of June 30, 2025.
This contraction — driven by decades of mergers, acquisitions, and private equity growth — has concentrated more of the market’s total capitalization in fewer names. Today, just 30 companies represent nearly half of the total U.S. equity market cap. That concentration exposes a key challenge for index design: how to maintain consistent market representation as market structure changes.
The CRSP Difference: Market Coverage That Adjusts With the Market
The Center for Research in Security Prices (CRSP) developed its U.S. index family to solve precisely this issue. Instead of fixing the number of companies included in an index, CRSP builds its benchmarks using cumulative market capitalization percentiles. This approach begins with the full investable universe — the CRSP US Total Market Index — which currently captures about 3,500 securities.
PERMCO, short for “permanent company number,” is the proprietary CRSP unique identifier assigned to each company in the CRSP database. The common and preferred stock of a single company will always the same PERMCO, allowing researchers to group all the securities issued by a single company).
From there, CRSP defines each segment of the market (large, mid, small, and micro) as a percentage of total market capitalization, not a set number of stocks. That means as the market evolves — whether new companies list, others merge, or concentration shifts — the indices automatically adjust to maintain consistent exposure to each market segment.
This methodology provides a more accurate reflection of the market at any point in time. For example, when the NASDAQ launched in the 1970s and thousands of new companies became publicly available, fixed-count indices didn’t expand to accommodate the influx — meaning their market coverage actually declined. By contrast, a cumulative cap approach, like CRSP’s, flexes with these changes, ensuring that index representation remains consistent and complete.
A More Dynamic Approach to Market Segments
Because CRSP uses target percentile ranges rather than fixed counts, each index within its family moves dynamically with the market. For instance:
• CRSP US Large Cap Index: Represents the top 85% of total market capitalization.
• CRSP US Mid Cap Index: Covers companies between the 70th and 85th percentiles.
• CRSP US Small Cap Index: Captures the 85th to 98th percentiles.
• CRSP US Micro Cap Index: Reflects the smallest 2% of the investable market.
By using market cap percentage-based definitions, CRSP’s indices maintain a consistent proportional view of the market — regardless of how many companies are trading or how concentrated market leadership becomes. This structure ensures that when market dynamics shift, exposure shifts with them.
Why It Matters for Investors
The goal of an index isn’t to outperform, that is, generate “alpha” — it’s to represent the market or a specific market segment accurately which is “beta”. Fixed-count indices may drift away from this goal as the underlying market changes, particularly when the number or size of publicly listed companies fluctuates. Percentile-based, cumulative methodologies like CRSP’s, on the other hand, maintain proportional exposure to the true composition of the market.
In periods of market expansion, these indices capture new entrants; in times of consolidation, they reflect growing concentration without losing the intended balance between large, mid, and small segments. The result is a consistent, representative measure of the U.S. equity market — one that evolves as the market itself does.
The Bottom Line
Market structure is dynamic, not static. The number of companies, their capitalization, and their relative weights change continuously. Indexes built on fixed numbers of constituents risk misrepresenting the underlying market as those dynamics shift. Cumulative-cap methodologies like CRSP’s are designed to move with the market, maintaining consistent, proportional exposure across the entire investable universe.
By anchoring exposures to market cap percentiles instead of arbitrary counts, CRSP’s approach ensures that each index continues to reflect the reality of the evolving U.S. equity landscape.


