
Leveraged ETFs: The Hidden Costs That Eat Your Returns
Hidden costs can turn a 2x bet into something far less.
Leveraged ETFs are expensive. That’s no secret.
ETF.com data shows the median expense ratio for U.S.-listed leveraged ETFs is 0.96%, versus 0.54% for the broader U.S. ETF universe.
But while those headline fees look steep, there’s another layer of costs most investors never see. In some cases, these “hidden” costs can be multiples of the stated fee—enough to make some question whether these products are worth holding at all.
That’s the argument Josh Russell made recently on X after posting returns for a single-stock leveraged ETF that badly lagged its underlying stock over the past three years.
It’s Not Volatility Decay
To most market watchers, the default explanation for long-term underperformance in leveraged ETFs is volatility decay, or the math that comes from these funds resetting leverage daily to match their target multiple (like 2x).
In choppy markets, that reset can create a “buy high, sell low” effect that steadily erodes returns compared with a simple multiple of the underlying’s long-term performance.
That drag is real, and in many cases it’s one of the biggest drivers of long-term lag. But in Russell’s example, volatility decay wasn’t the only culprit.
The Real Drag: Swaps
Instead, he points to the cost of the total return swaps the ETF uses to get its leveraged exposure.
“I’ve been quoted up to 19% to get one done,” Russell wrote. “That’s the true cost of margin on these funds.” He added that “swap interest is not reportable,” meaning that it doesn’t show up in the ETF’s expense ratio or prospectus.
In his analysis, the ETF in question—likely the Direxion Daily AAPL Bull 2X (AAPU), based on performance data—lagged its underlying stock by an average of 0.04% per day, or roughly 14.3% annualized. That’s more than thirteen percentage points above the ETF’s advertised expense ratio.
I ran my own calculation using Apple’s actual daily returns over the same period, applying leveraged daily moves to match the fund’s target (1.5x until April 2, 2024, then 2x) and compounding them. That “perfect” leveraged model—which includes the effect of daily rebalancing but excludes all fees and financing—returned about 27%.
We can compare that to a different “perfect” scenario: a hypothetical where the ETF never rebalanced and simply delivered its target multiple over the entire holding period. Because AAPU targeted 1.5x Apple for the first part of the period and 2x thereafter, I adjusted the target accordingly.
That works out to about a 45% gain if the ETF perfectly hit its target without any volatility drag or financing costs (about 1.8x Apple’s 25% return). The difference between that 45% baseline and the 27% “perfect” leveraged return—about 18 percentage points—is the drag from volatility decay.
But the actual ETF’s return was even worse than the 27% “perfect” figure.
It was only 2.3%, which means there’s another 25 percentage points of lag that can’t be explained by volatility decay alone. That gap is far too large to be the 0.97% headline fee—instead, it’s likely those high financing costs that Russell pointed to.
To be sure, this issue isn’t unique to AAPU. GraniteShares and T-REX each offer their own 2x Apple ETFs, and both have shown similar performance gaps versus a “perfect” leveraged model.
And this isn’t just an Apple ETF phenomenon, either. In some cases, the financing drag can be far more severe.
When the Drag Turns Extreme
At the far end of the spectrum is the T-Rex 2X Long MSTR Daily Target ETF (MSTU). In its first 11 months (Sept. 18 to Aug. 11), it returned 208%—a staggering 126 percentage points less than a “perfect” 2x MicroStrategy model, and just barely more than the 205% return for MicroStrategy stock itself.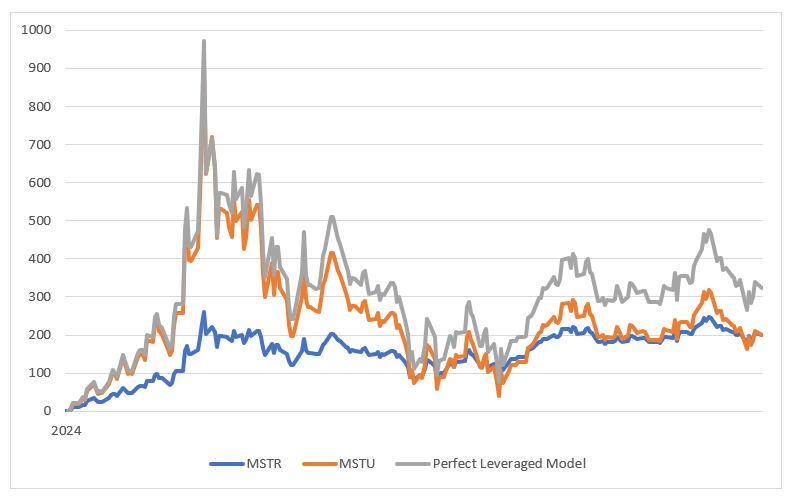
Last November, Bloomberg reported that the fund was struggling to obtain the swap exposure it needed from its prime brokers, forcing it into the options market for leverage. At the time, MSTU’s holdings included a mix of swaps, call options, and common stock. More recently, according to the issuer’s website, the fund has shifted to holding only swaps.
It’s an extreme example of how financing costs and market frictions can overwhelm the returns a leveraged ETF is designed to deliver.
Why Would a Swap on Apple Be So Expensive?
If the financing challenge for MicroStrategy is clear—it’s a highly volatile, less-liquid stock—it’s worth asking why swaps on Apple are so costly. Apple is, after all, one of the most traded stocks in the world.
It comes down to hedging tools, liquidity, and concentration risk. The S&P 500 has a deep, liquid futures market that lets prime brokers hedge cheaply and efficiently. Apple doesn’t. Without a liquid futures market, swap counterparties generally have to hedge by trading Apple shares directly, which comes with wider spreads, higher execution risk, and more market impact.
Daily rebalancing magnifies the problem. Large, predictable end-of-day trades in Apple are a heavier footprint in its market than similar-sized trades in S&P futures. Bank capital rules also make concentrated single-stock exposures more expensive for prime brokers to hold. And if that’s true for Apple, one of the most liquid stocks in the world, it’s even more pronounced for smaller names.
The result is borrowing rates that, according to Russell, can run into the double digits—far higher than typical retail margin rates (he cited Interactive Brokers’ margin rate at 5.8% for comparison).
Not All Leverage Costs the Same
Some people who responded to Russell’s post noted that not every ETF pays so much for leverage. Case in point: the ProShares Ultra S&P 500 (SSO), a 2x ETF tied to the S&P 500. Over the past year (Aug. 12 to Aug. 11), it gained 32% versus 37% for a “perfect” 2x SPX model—a gap of just 5 percentage points, only slightly more than the risk-free interest rate.
For comparison, AAPU fell 10.3% over the same period, while the perfect 2x Apple model was roughly flat—a gap of about 10 percentage points. In other words, over the past year, AAPU’s embedded financing costs were roughly double those of SSO.
Another angle to consider is how much leverage the ETF takes on. The ProShares UltraPro S&P 500 (UPRO) has a financing rate similar to SSO’s, but as a 3x fund it’s borrowing about 200% of its net asset value instead of 100%. Over the past year, UPRO returned 41% versus 52% for a perfect 3x SPX model—an 11-point difference. That’s roughly twice SSO’s gap, simply because the amount borrowed is twice as large.
These examples suggest that financing costs vary widely. They’re lowest in deep, liquid markets like S&P 500 futures, higher in single-stock swaps, and they scale up as you add more leverage.
Russell acknowledged that “the cost of leverage will vary and there are cheap swaps out there.” His main concern was transparency: “The right thing for the investor is to get leverage as cheap as possible. The right thing for the fund company is to get leverage with the lowest advertised rate.”
Limits to Transparency?
The cost debate spilled into another thread between Corey Hoffstein, CEO and CIO of Newfound Research, and Wes Gray, CEO and CIO of Alpha Architect.
Hoffstein asked whether implicit funding costs from futures and swaps should be backed out and quoted in prospectuses.
Gray said probably yes, noting that transparency makes markets more efficient and increases competition.
Hoffstein responded that the extremes are easy to identify, but “you fall down a rabbit hole quickly trying to define the cost of financing.”
“Spot gold requires cost of storage, insurance, transportation, etc. This is all embedded in futures as well. Do we have to back that out to get the financing cost? Are we also going to estimate convenience yield? How are we going to deal with the fact that [futures] curves can change rapidly and the prospectus snapshot is infrequent?”
Gray’s view was that while defining these costs can be messy, the benefit of disclosure outweighs the complexity. Greater transparency, he argued, would likely pressure providers to lower rates, and it would help investors understand when high embedded financing is eating away at returns.
“It has dramatic effects on returns that can only be seen in NAV, after the fact, when you are missing 10% from expectation,” he said.
Why Investors Use Them Anyway
Even with high costs, leveraged ETFs hold appeal for many traders. They’re easy to buy (no margin or futures account needed) and they maintain a fixed multiple of exposure automatically.
In a regular margin account, you’d have to rebalance your position every day to maintain a constant leverage ratio. Left alone, a margin position’s leverage will drift as the market moves, and most traders simply accept that.
Leveraged ETFs, by contrast, are designed to rebalance daily. Whether that helps or hurts returns depends on the market environment, but it’s a key part of how they work.
Another major difference is the absence of margin calls. Because the ETF structure contains the leverage inside the fund, investors can never be forced to add collateral or liquidate positions if the market moves against them.
Leveraged ETFs can also offer turbocharged exposure to hard-to-access markets, such as certain international indexes or commodities, and can be held in accounts—like IRAs or 401(k) brokerage windows—where margin isn’t allowed.
The Bottom Line
For traders who hold leveraged ETFs for only a day or two, the financing mechanics don’t matter much. But for anyone holding longer, the cost of leverage is certainly more important than the headline expense ratio, and in some cases, just as much (or more) of a headwind to returns as the decay from daily rebalancing.
Volatility decay, after years of education, is now widely understood as a potential source of drag in leveraged ETFs. Financing costs, however, are far less appreciated.
And while daily rebalancing sometimes boosts returns, financing costs always subtract from what you would otherwise earn. In today’s higher interest rate environment, that can add up to significant sums.


