

One Country Is Powering IEMG’s Surge Past VWO
The two ETFs look similar on paper, but a single market has made all the difference in flows and performance.
When investors want broad, low-cost exposure to emerging markets, they usually end up choosing between two giants, the iShares Core MSCI Emerging Markets ETF (IEMG) and the Vanguard FTSE Emerging Markets ETF (VWO).
Both funds are massive. IEMG has about $133 billion in assets under management, while VWO sits just behind it at roughly $111 billion. Both are cheap, diversified index ETFs designed to serve as core emerging-markets exposure.
But despite their similarities, investors have been favoring one over the other.
Different Indexes
VWO tracks the FTSE Emerging Markets All Cap China A Inclusion Index and currently holds more than 6,200 stocks. IEMG tracks the MSCI Emerging Markets Investable Market Index and owns about 2,700.
Fees are similar. VWO charges 0.07% per year, while IEMG charges 0.09%.
Flows, however, are not.
This year, IEMG has pulled in roughly $6 billion, making it the third most popular ETF U.S.-listed ETF overall. VWO, by comparison, has gathered about $1.1 billion. Over the past year, IEMG has attracted nearly $25 billion in net inflows, more than double VWO’s roughly $10 billion.
The South Korea Factor
It’s impossible to know exactly why investors are favoring IEMG, but one difference stands out: South Korea.
MSCI classifies South Korea as an emerging market, while FTSE considers it a developed market. As a result, IEMG holds South Korean stocks, while VWO does not.
South Korea makes up close to 15% of IEMG’s portfolio and zero percent of VWO’s. That distinction has mattered a lot recently.
South Korean equities have surged, driven largely by strength in memory-chip makers tied to the AI boom. The iShares MSCI South Korea ETF (EWY) jumped about 95% last year and is already up roughly 20% this year, with Samsung Electronics and SK Hynix accounting for nearly half of the fund.
That strength has flowed directly into IEMG’s returns.
In 2025, IEMG gained about 33%, compared with roughly 26% for VWO. South Korea alone contributed more than eight percentage points of IEMG’s return, explaining most of the performance gap.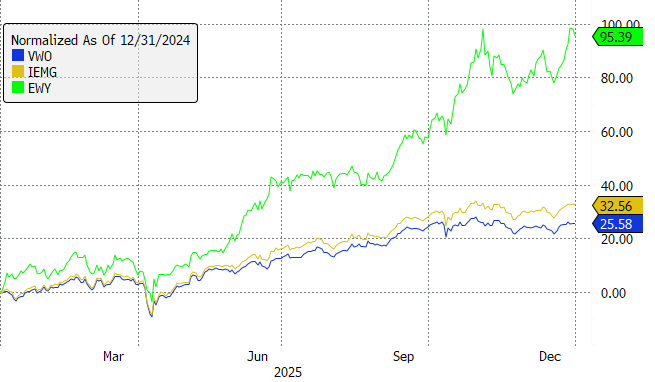
The pattern has continued this year. With South Korea up about 20% year to date, IEMG is up roughly 7.4%, while VWO has gained about 5.5%. South Korea accounts for roughly two percentage points of IEMG’s return so far, again explaining most of the difference.
It’s not hard to imagine some investors gravitating toward IEMG based on recent performance, even if they do not fully appreciate that much of the outperformance is being driven by a single country.
It Doesn’t Always Work This Way
Though it’s helping now, South Korea exposure cuts both ways. In 2024, when South Korean stocks fell more than 20%, VWO outperformed IEMG by over 400 basis points.
It’s also worth noting that South Korea is not the only difference between the two funds.
VWO is more heavily weighted toward mainland China, with about 32% of its portfolio allocated there, compared with roughly 25% for IEMG. Taiwan makes up about 23% of VWO versus 21% for IEMG. India represents about 20% of VWO and closer to 15% of IEMG.
That said, those differences are largely a downstream effect of South Korea’s absence from VWO. When one large market is removed, the weights of the remaining countries naturally rise.
Long-Term Results
Over longer time horizons, the South Korea distinction has mattered far less.
Over the past five years, IEMG is up about 24%, while VWO is up roughly 23%. Over the past ten years, IEMG has gained about 164%, compared with 158% for VWO.
Even that gap is heavily influenced by the most recent year. From the end of 2014 through the end of 2024, VWO actually outperformed, returning about 48% versus roughly 45% for IEMG. During that period, South Korean stocks rose only about 11%, acting as a drag rather than a boost.
For now, IEMG is benefiting from its South Korea exposure. Over full cycles, though, the two funds have delivered very similar results.


