

Silver ETFs Rally Toward Records: Can $50 Be Broken?
Silver prices are closing in on record highs, fueling gains for ETFs tied to the metal.
Silver prices are closing in on levels not seen in more than a decade. The precious metal was last trading around $44 per ounce, up nearly 49% year-to-date. That puts silver within striking distance of its all-time high of $49.80 from April 2011, a level comparable to the $49 peak hit back in 1980.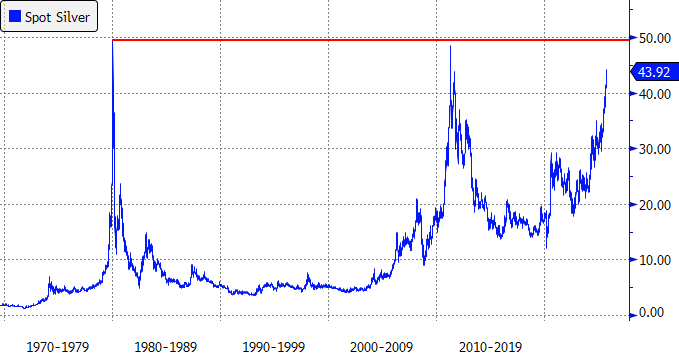
Breaking through $50 would be a major milestone for silver, which has long lagged its more glamorous cousin, gold. Silver is modestly outperforming gold this year—49% versus 41%—but it’s lagged considerably over longer periods.
Gold has nearly doubled from its 2011 peak and more than quadrupled from its 1980 high, while silver is still down more than 10% from those levels.
Gold/Silver Ratio Still Elevated
One way traders frame the relationship between the two metals is through the gold/silver ratio, which measures how many ounces of silver it takes to buy one ounce of gold. The ratio hit a modern-era high of 124 in 2020, compared with a low of 32 in 2011. Today, it sits near 85, down from this year’s high of 105.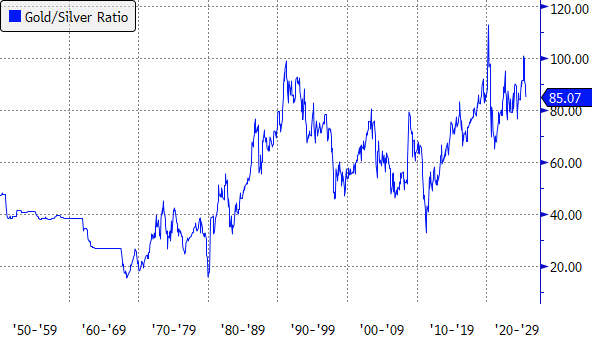
To silver bulls, that still-elevated level suggests silver has plenty of room to run relative to gold. Skeptics counter that the two metals serve very different roles: gold as a safe haven, silver as more of an industrial metal.
ETFs Reflect the Difference
That distinction is apparent in ETF assets and flows. U.S.-listed silver ETFs like the iShares Silver Trust (SLV) hold about $26 billion in assets, compared with nearly nine times that for gold ETFs such as the SPDR Gold Shares (GLD). Investors have poured roughly $2 billion into silver ETFs this year, versus $33 billion into gold ETFs.
According to forecasts from the Silver Institute, industrial uses and photography will account for nearly two-thirds of silver demand this year. Jewelry and physical investment will make up the rest.
Gold’s profile is the mirror image. Investment demand alone represented more than 38% of global gold demand in the second quarter, per the World Gold Council, while industrial uses were just 6%.
Central banks made up another 13% of demand, while jewelry accounted for 29%. Both categories often function as investment channels for the yellow metal.
These figures suggest that silver is much more of an industrial metal than gold.
Still, when gold surges, silver sometimes rides along as a cheaper alternative. With the yellow metal exploding higher this year, silver has followed, aided by bargain-hunting investors and technical momentum.
The big question is whether silver can finally crack $50. From a chart perspective, that level represents formidable resistance. But as long as momentum holds, silver has at least a shot at testing that mark.


